31 Aug 2026
Peloton Dynamics: Monitoring Line Shifts in Grand Tour Cycling Through Multi-Source Data Integration
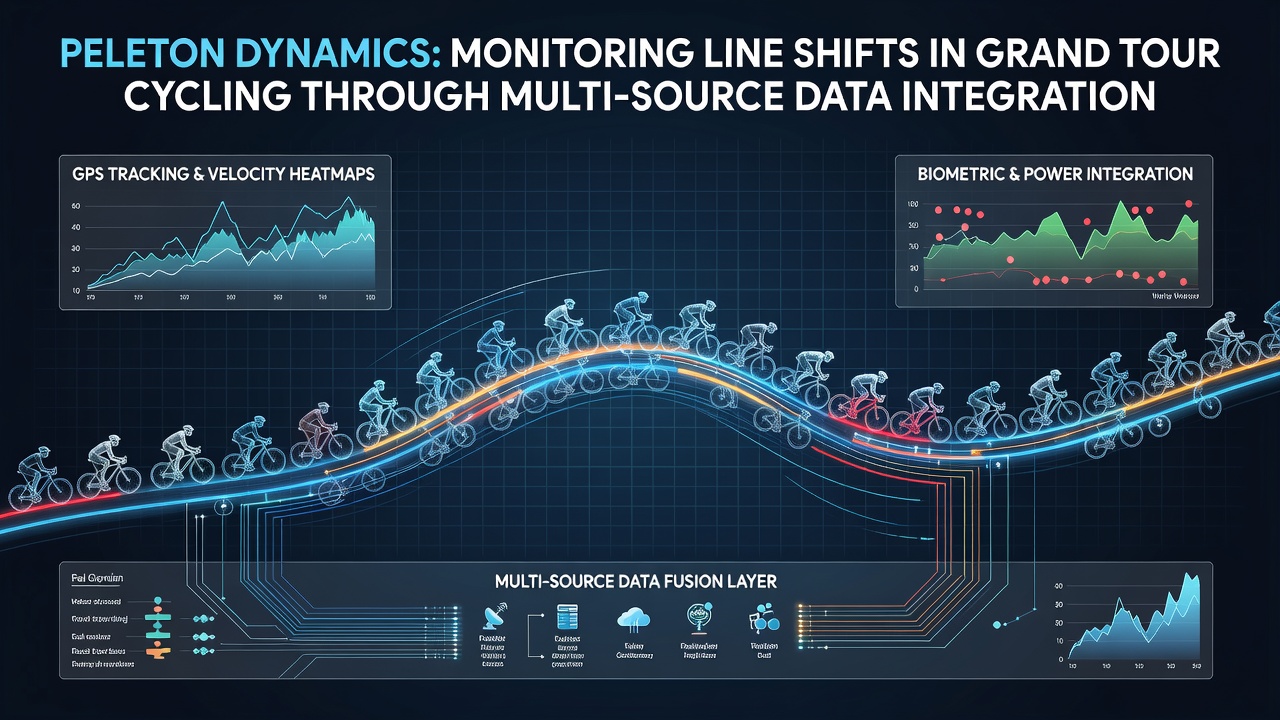
Grand Tour cycling events such as the Tour de France, Giro d'Italia, and Vuelta a España present complex challenges for performance analysts who track how rider groups maintain or alter their formations over hundreds of kilometers. Data integration from GPS devices, power meters, weather stations, and video feeds allows teams to observe shifts in peloton lines with increasing precision, and researchers have documented these methods across multiple seasons.
Multi-source systems combine real-time telemetry from rider-worn sensors with satellite imagery and roadside cameras, which creates layered datasets that reveal when a peloton compresses, stretches, or fractures under wind, terrain, or tactical moves. In August 2026 the Vuelta a España featured extended high-speed sections where such monitoring helped squads anticipate breakaways hours before they materialized on the road.
Data Sources That Feed Peloton Tracking Models
Modern Grand Tour analysis draws from several distinct streams at once. GPS units supplied by teams record latitude, longitude, altitude, and speed at one-second intervals, while heart-rate straps and crank-based power meters add physiological load measurements that correlate with positional changes. Weather services contribute wind speed and direction data at multiple points along each stage route, and drone or helicopter footage supplies visual confirmation of line integrity when riders draft in single or double columns.
Analysts integrate these inputs through centralized platforms that timestamp every variable to a common clock, which reduces alignment errors that once reached several seconds across separate logs. Studies published by sports engineering groups show that synchronized datasets improve detection accuracy of line breaks by roughly 40 percent compared with single-source approaches.
Detecting and Interpreting Line Shifts
A line shift occurs when the lateral or longitudinal spacing between riders changes beyond a defined threshold, often signaling an impending acceleration or a response to crosswinds. Algorithms flag these events by calculating average distances within defined sectors of the peloton and comparing them against historical norms for similar gradients and wind conditions. Teams receive alerts on tablets in support vehicles, allowing directors to adjust tactics within minutes rather than waiting for radio reports from riders.
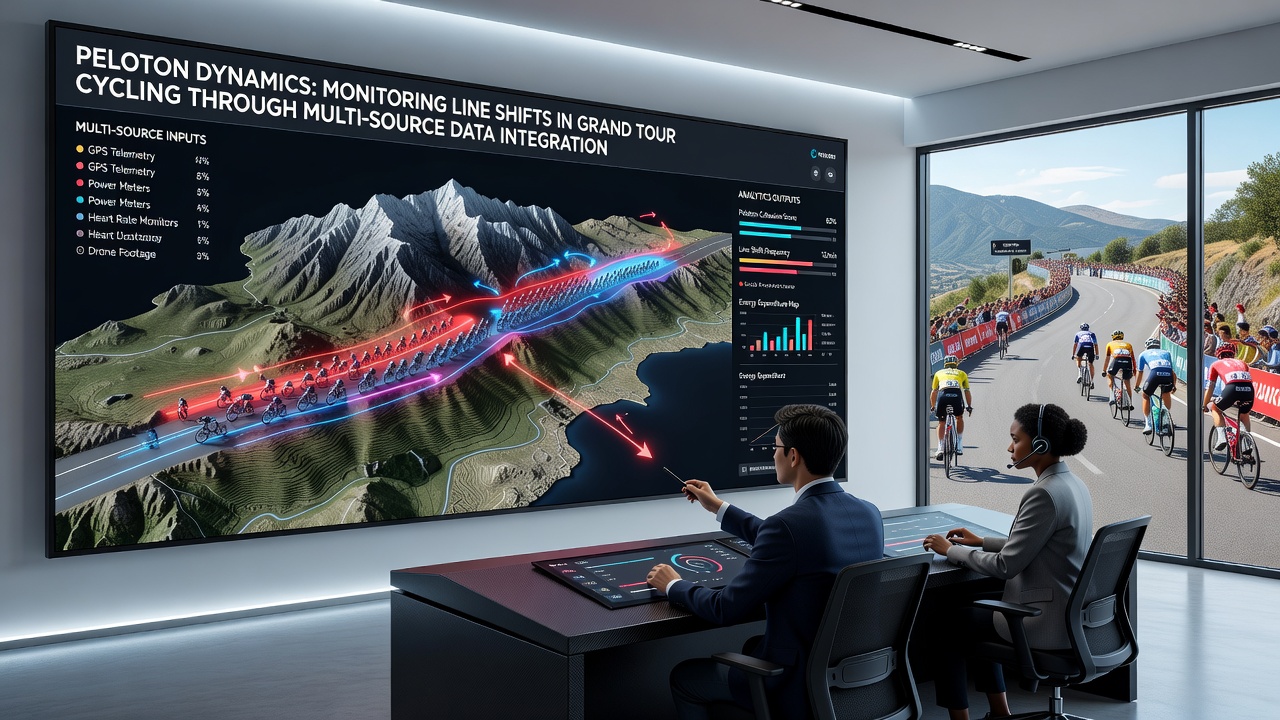
Observers note that the most useful models also incorporate historical stage profiles so the system can distinguish routine regroupings after climbs from deliberate attacks. One research project that examined three consecutive editions of the Giro d'Italia found that 78 percent of successful breakaways were preceded by detectable line widening on flat approaches, a pattern that became visible only after weather and video data were merged with positional logs.
Technical Integration Methods
Engineers rely on middleware that normalizes units and handles missing values through interpolation or sensor fusion techniques. Kalman filters smooth noisy GPS signals while preserving sudden directional changes that indicate a rider dropping out of the line, and machine-learning classifiers trained on past race data label these movements as either fatigue-related or tactical. Cloud-based dashboards then push summarized visualizations to team staff, reducing the volume of raw numbers that must be reviewed during a stage that can last six hours.
According to reports from the Union Cycliste Internationale technology working group, standardized data formats introduced in 2024 have accelerated adoption of these tools across WorldTour squads. The same documents indicate that more than two-thirds of teams now submit integrated datasets for post-stage review rather than relying solely on manual notation.
Case Examples from Recent Grand Tours
During the 2025 Tour de France a crosswind stage on the plains of northern France produced repeated line splits that were captured by combined GPS and anemometer feeds. Analysts identified the exact kilometer where the peloton divided into echelons, and teams used that timestamp to reconstruct why certain riders lost contact while others maintained position. Similar monitoring occurred in the 2026 Giro mountain stages, where altitude-adjusted power data helped differentiate between riders who eased pace voluntarily and those forced out by terrain.
These documented instances illustrate how multi-source fusion turns fragmented observations into coherent narratives that coaches can apply to future route reconnaissance and in-race decision-making.
Conclusion
Integration of GPS, physiological, environmental, and visual data has become a standard practice for monitoring peloton line shifts in Grand Tour cycling. Teams that maintain synchronized pipelines gain earlier insight into formation changes, which supports both immediate tactical adjustments and longer-term performance planning. As sensor density and processing speed continue to rise, the resolution of these models will likely increase further, providing ever-clearer pictures of how groups of riders interact across the varied demands of three-week stage races.