12 Oct 2026
Badminton Betting Disparities: Integrated Tools for Tournament Analysis

Badminton tournaments generate frequent odds variations across international bookmakers, and integrated calculators paired with market comparison platforms help identify these gaps in real time. Observers note that major events such as the BWF World Tour Super Series produce rapid shifts in pricing because player form, fatigue factors, and head-to-head records update between exchanges and traditional sportsbooks.
How Disparity Detection Functions in Practice
Disparity detection starts when software pulls live odds from multiple operators and feeds the figures into a central calculator that applies formulas for arbitrage and value assessment. Researchers at institutions tracking global wagering patterns have documented that badminton matches often display wider spreads than many other racket sports because liquidity varies sharply between Asian, European, and North American platforms. Data from the 2026 season shows these differences peak during quarterfinal and semifinal stages when betting volumes surge.
Calculators convert each set of odds into implied probabilities, then compare the results against aggregated market benchmarks. When the combined probabilities fall below 100 percent, an arbitrage window opens; when one price deviates from the consensus by a defined threshold, a value bet registers. Those who monitor these systems report that badminton’s scoring structure, which allows matches to finish in straight sets or extend to three, creates repeated recalculation points that keep odds fluid.
Role of Integrated Calculators During Live Play
Integrated tools combine scanner feeds with bankroll modules so users can size stakes automatically once a discrepancy appears. In October 2026, several Super 750 events in Asia demonstrated how these systems flagged inconsistencies between early morning lines on European exchanges and midday adjustments on regional operators. The calculators adjusted for serve percentages and rally lengths that differed from historical averages, producing updated probabilities within seconds of each point.
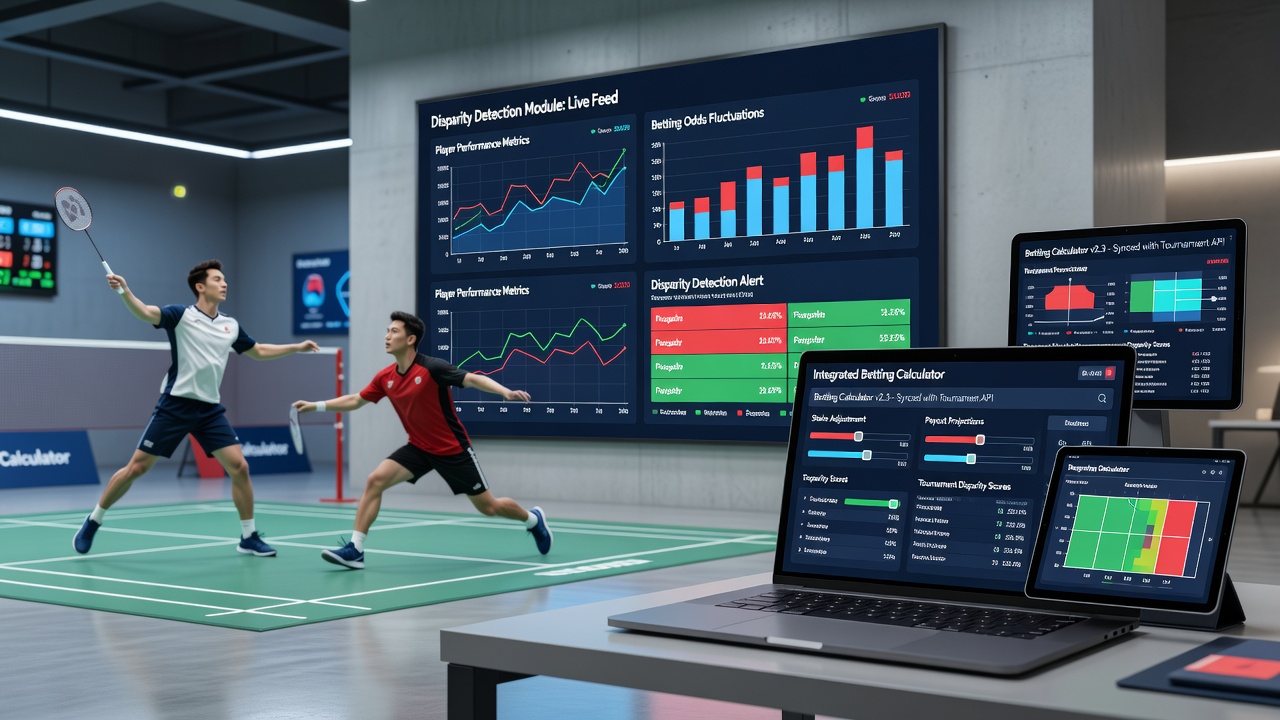
Market comparison dashboards display color-coded alerts when spreads exceed preset limits, allowing rapid cross-checks against injury reports or schedule changes. Figures from industry reports indicate that such alerts occurred on average 12 times per elite match during the autumn schedule, with the largest gaps appearing in doubles events where partner chemistry data remains less standardized.
Cross-Market Comparisons and Data Sources
Cross-market analysis draws on feeds from licensed operators in multiple jurisdictions, including data compiled by the Australian Gambling Research Centre and reports issued by the European Gaming and Betting Association. These sources track how odds on the same player can differ by several percentage points depending on the platform’s regional customer base and hedging activity. Analysts combine this information with real-time score inputs to refine calculator outputs before each serve.
Studies published by university sports analytics groups have examined badminton’s unique volatility drivers, such as the impact of shuttle speed regulations and court surface variations. The findings show that markets react more sharply to mid-match adjustments in badminton than in longer-duration sports, which explains why integrated tools emphasize continuous rather than static comparisons.
Case Examples from Recent Events
During the October 2026 Denmark Open, one doubles pairing attracted divergent pricing after an unexpected schedule change moved their quarterfinal to a later time slot. Calculators detected a 3.8 percent spread between two major exchanges within minutes, and automated staking modules adjusted wager sizes according to remaining bankroll parameters. Similar patterns emerged at the Japan Masters where men’s singles matches produced repeated value alerts tied to differing assessments of recovery time between rounds.
Those monitoring scanner outputs note that badminton’s shorter match duration allows discrepancies to resolve faster than in multi-set tennis encounters, which places a premium on rapid data ingestion. Market comparison platforms therefore prioritize API connections that refresh every few seconds during live play.
Conclusion
Integrated betting calculators and systematic market comparisons provide structured methods for identifying odds disparities in badminton tournaments. Evidence from recent international events confirms that these tools process live data across regions and deliver updated probabilities at key scoring intervals. Continued refinement of scanner algorithms and broader access to operator feeds will likely sustain the visibility of such gaps in future seasons.